USER GUIDE > FLOW
Flow depicts the flow of your money. This analysis is frequently used to assess your cashflow. It provides a picture of the amount of money coming in, where it is coming from, and how much is going out.
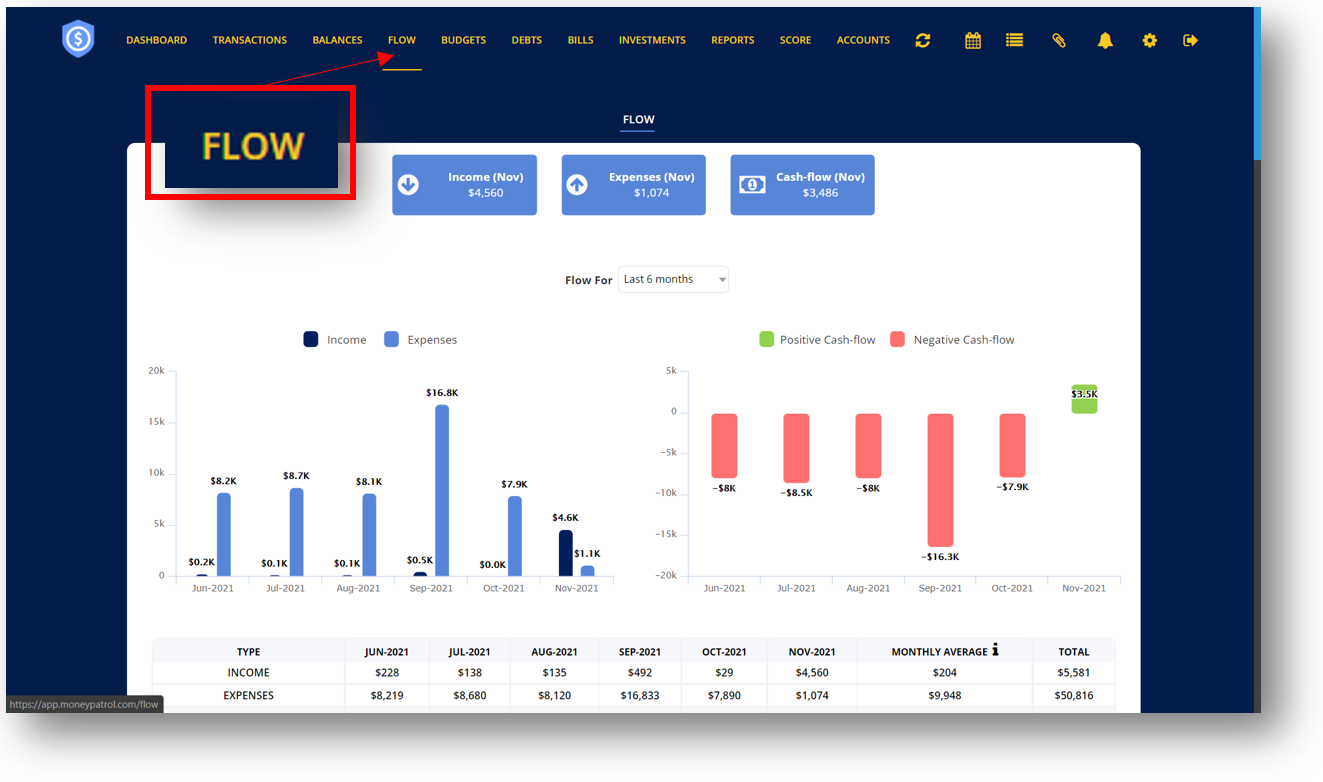
The blue boxes at the top display the amount of your current month’s income, expenses, and cash flow.
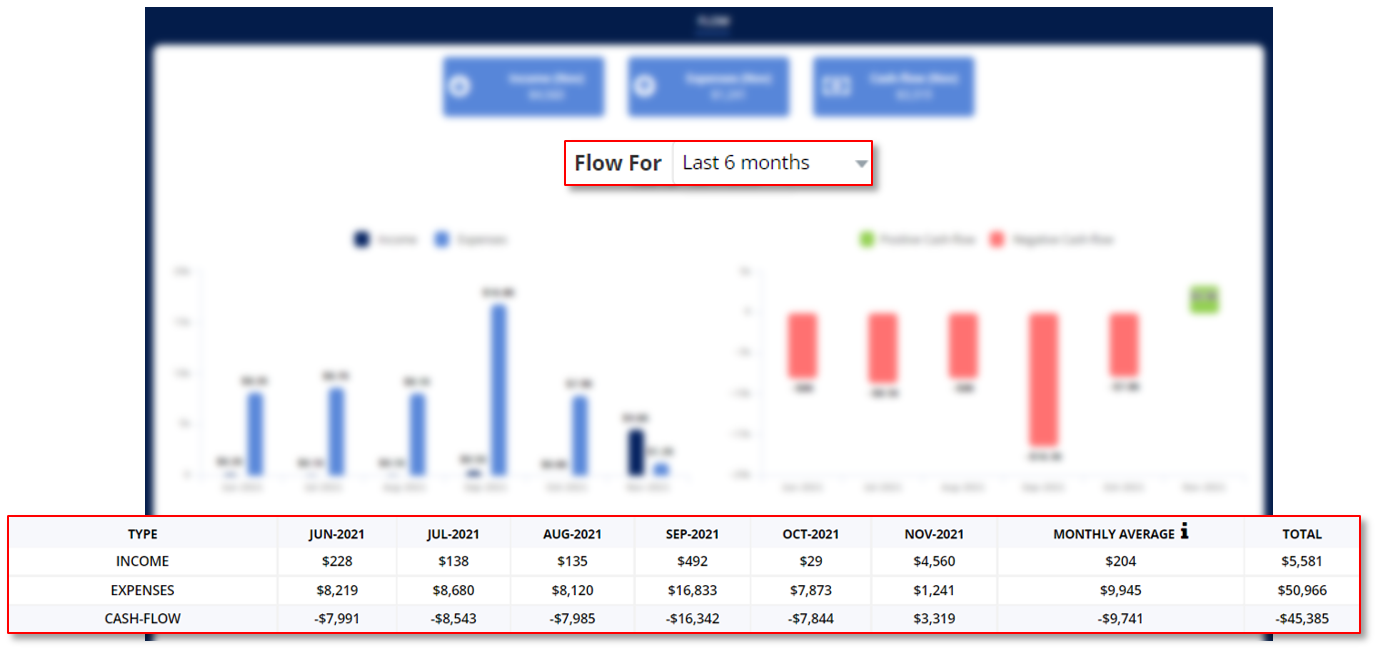
You can also check your cash-flows up to a year ago by clicking on the drop-down button next to “Flow For” and then pick a time period.
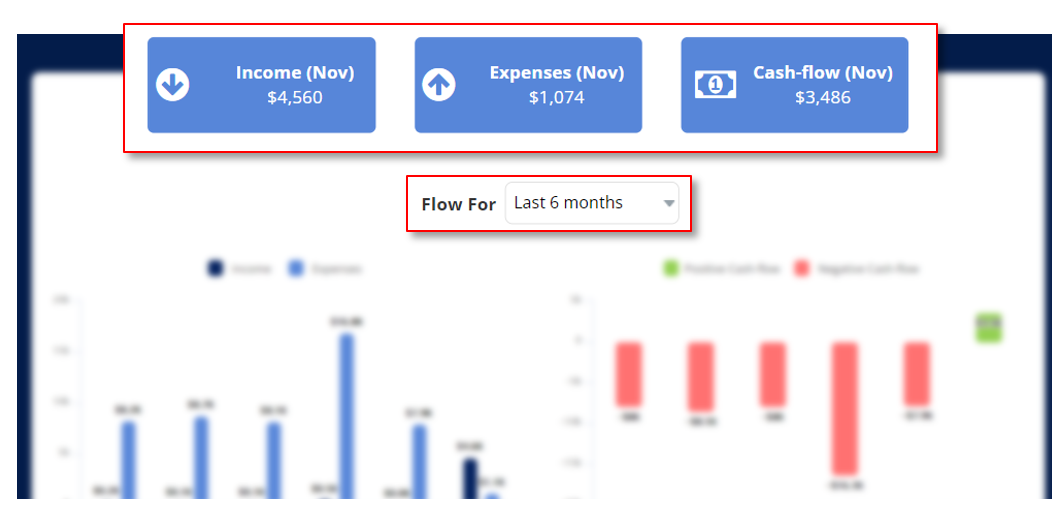
TABLE OF CONTENTS
a. Income and Expenses
b. Cash Flow
c. Recent Expenses and Income
d. Merchant and Category Insights
e. Spend Share by Category
INCOME & EXPENSES
Income is the amount earned or received in a certain period, whereas expenses are the costs for products or resources used up or consumed in the course of everyday living.
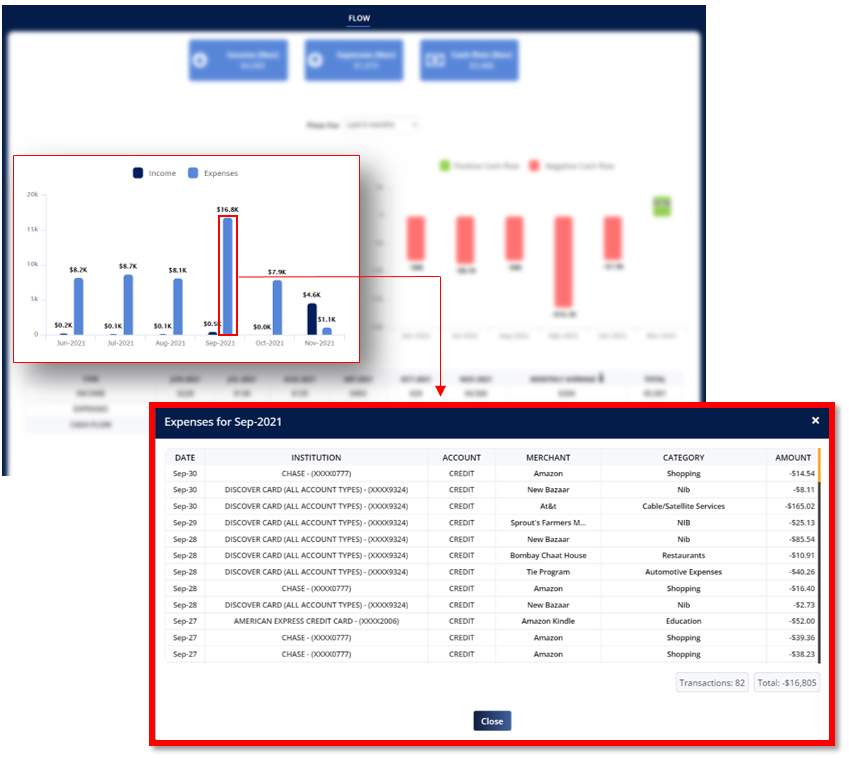
The graph below allows you to visually assess how much money comes in each month and how much is expended. If your income is less than your expenses, you have a budget deficit, which indicates you don’t have enough money to satisfy your goals and needs.
Your expense is represented by the blue bar graph, while your income is represented by the darker bar graph. To examine all of your income and expense transactions for each month, click on any of the bar graphs.
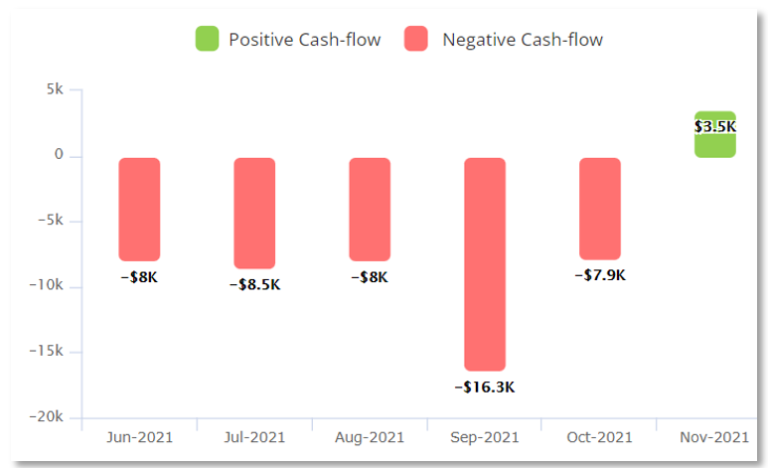
CASH FLOW
Cash flows can either be positive or negative. It is computed by deducting your expenses from your income. If the difference is positive, it indicates that you have more cash at the end of the month. If the difference is negative, it implies you have less cash and spent more than what you earned.
A green bar graph represents a positive cash-flow whereas a red bar graph represents a negative cash-flow.
Your Income, Expenses and Cash-Flow is also displayed in a table format. This also shows you your Monthly average which is
If you want to check at your cash-flows from up to a year ago, select a time range from the drop down menu next to “Flow For.” After that, you’ll be able to see more of the prior flow.
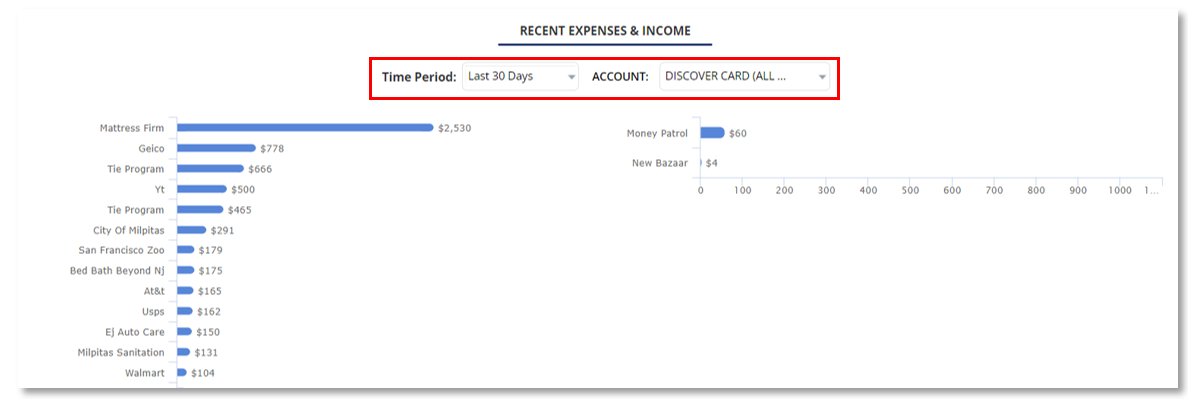
RECENT EXPENSES & INCOME
This area shows the merchant as well as the amount of your most recent expense and income. You may select a time period and a specific account to view. Simply click on the drop-down icon and make your selection.
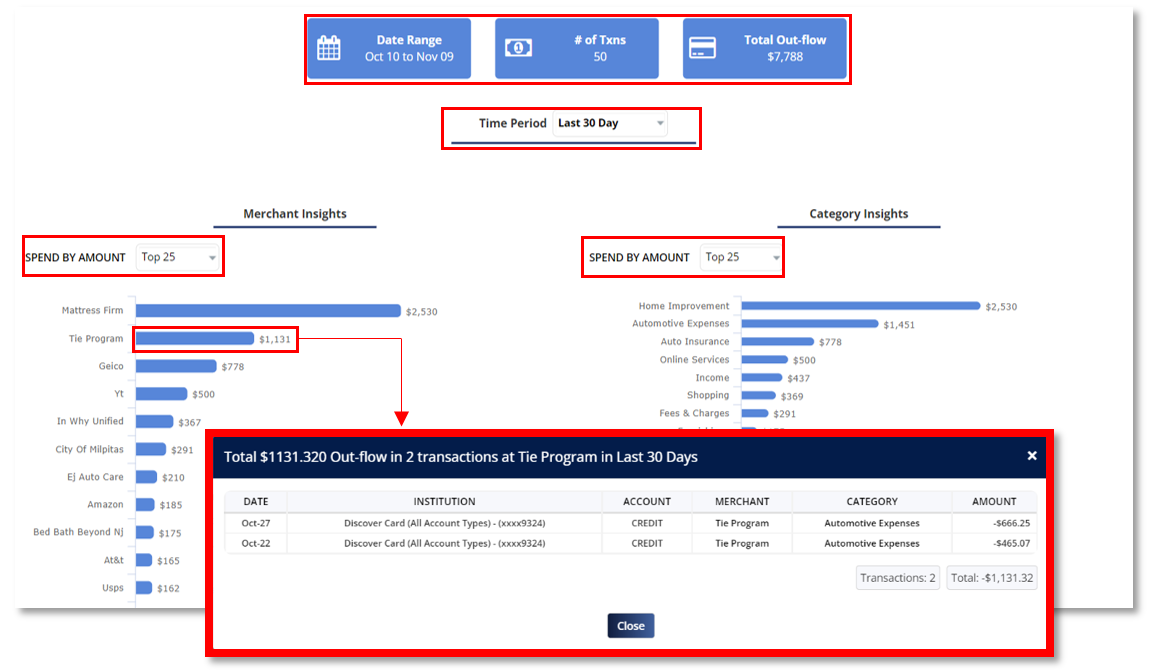
MERCHANT AND CATEGORY INSIGHTS
- Select a time period to view by clicking the dropdown menu option next to “Time Period.” This restricts the shown transactions to those that fall within your specified time period.
- Date Range- This displays the date range based on the time period you selected.
- # of Txns- This is the number of transactions that occurred during the time period you selected.
- Total Out-Flow- This is the total amount of money spent within the specified time period.
- You may view only the Top 25 transactions or all transactions from the Merchant Insights and Category Insights. To make these selections, click the drop-down menu button.
- Click on the blue bar and a pop-up window will appear displaying all the transactions associated with the merchant or category name you selected.
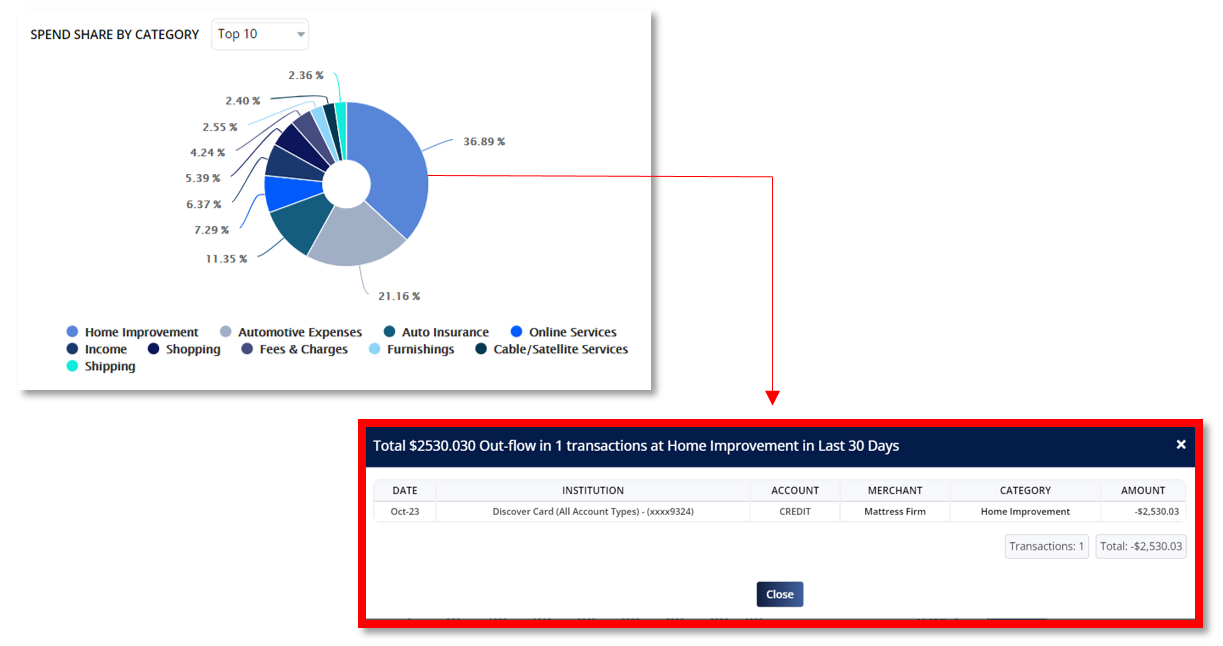
SPEND SHARE BY CATEGORY
Spend Share by Category displays the money you spent in a pie graph format for the time period you selected. By using the drop down menu, you can select to display simply the top 10 or all spend shares.
When you click on any of the pies, a pop-up window will appear, detailing all transactions linked with that category within the time period you selected.