
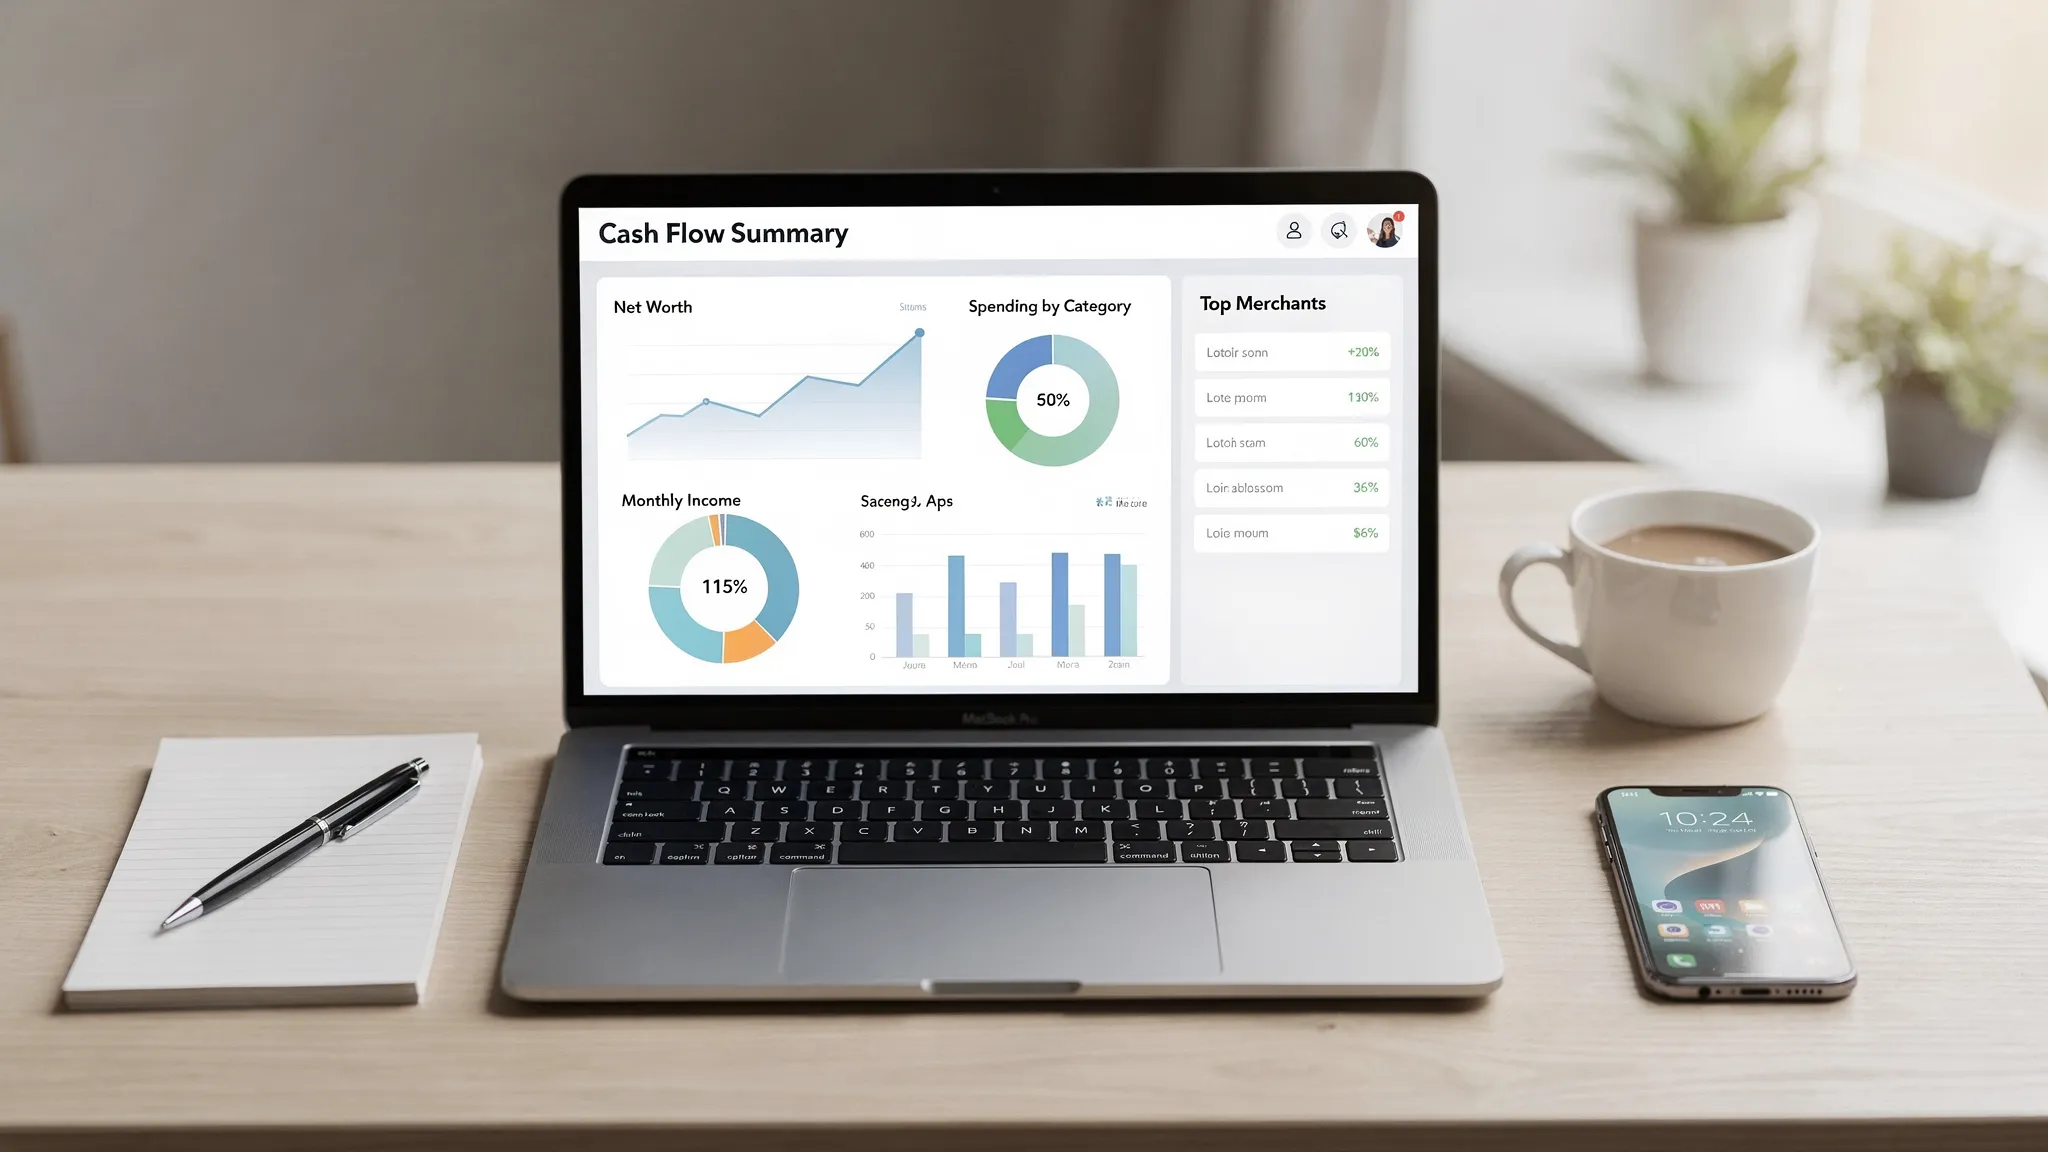
Most people don’t need more data about their money. They need a few reports that reliably answer the same questions every week:
- Where did my money go?
- What changed since last month?
- What can I adjust before I overspend?
Good spending tracking software makes those answers obvious, without you having to become an accountant. Below are the reports that real people actually use (and why), plus how to set them up so they stay accurate.
What makes a “useful” spending report
A report is only helpful if it changes a decision. In practice, the best reports share four traits:
Actionable: It clearly suggests a next step (cancel, cap, move, negotiate, pause).
Fast to review: If it takes 20 minutes to interpret, you won’t keep using it.
Consistent rules: Categories and time periods are stable, so comparisons mean something.
Close to reality: It reflects your real cash flow (including bills, subscriptions, transfers, refunds, and split transactions).
If you’re evaluating spending tracking software, prioritize reporting that supports those traits over fancy charts.
The 9 spending reports you’ll actually use
These are the reports most households come back to, because they connect directly to everyday decisions.
1) Cash flow summary (income vs spending vs savings)
This is your “money heartbeat.” It answers: Did I live within my means this month?
What to look for:
- A simple month (or paycheck period) view
- Totals for income, spending, and what’s left
- The ability to compare month over month
How you’ll use it:
- If spending is consistently above income, you need category caps, bill timing changes, or debt restructuring.
- If income is steady but savings are not, your issue is usually “leakage” (small recurring costs, dining, impulse shopping).
Tip: The cash flow view is far more useful when it includes known upcoming bills, not just what already posted.
2) Spending by category (with trends)
This is the report people imagine when they think “expense tracker,” and it’s still the most practical. It answers: Which buckets are actually driving my overspending?
What to look for:
- Category totals plus a trend line (not just a pie chart)
- The ability to drill down from category to merchants to transactions
How you’ll use it:
- Pick 1 to 3 categories with the biggest swings (often dining, groceries, shopping, travel).
- Set realistic targets based on your last 60 to 90 days, then tighten gradually.
Common pitfall: If everything ends up in “Other,” the report becomes noise. A good tool makes recategorizing quick and learns over time.
3) Merchant spend report (top payees)
Category views are great, but merchant views create the “aha” moment. This report answers: Who am I paying the most, and is it worth it?
You’ll use it to:
- Spot expensive habits hidden across categories (for example, multiple delivery apps)
- Catch duplicate services (two cloud subscriptions, two gyms)
- Identify negotiables (internet, mobile, insurance)
Pro move: When you see a top merchant you want to reduce, set a spend alert tied to that merchant or category.
4) Recurring charges and subscriptions
For many households, this is the highest ROI report. It answers: What am I paying every month that I’m not actively choosing?
What to look for:
- Recurring transaction detection
- A list of subscriptions with amounts and frequency
- The ability to see the first date it appeared (to confirm it’s truly recurring)
How you’ll use it:
- Cancel or pause low value subscriptions
- Swap annual billing for monthly (or vice versa) based on cash flow
- Replace premium tiers with basic tiers
If you want a strong benchmark for why this matters, consumer research consistently shows many households are financially stressed by rising prices and “everyday” expenses. A recurring charge report helps you reduce those expenses without major lifestyle changes. For broader context on household financial conditions, see the Federal Reserve’s Survey of Household Economics and Decisionmaking (SHED).
5) Budget vs actual (variance report)
This is the report that turns tracking into behavior change. It answers: What am I on track to overspend, and by how much?
The key is variance, not perfection.
What to look for:
- Actuals vs budget, plus variance in dollars
- Mid month pacing (so you can adjust before month end)
- The ability to exclude or group irregular expenses (for example, annual fees)
How you’ll use it:
- If a category is already over by mid month, you know exactly where to tighten.
- If you underspend, you can intentionally redirect that money to savings or debt.
6) Bills calendar and upcoming obligations
A calendar view answers: What hits my account next, and will I have enough?
This is especially useful if you:
- Get paid biweekly
- Have variable bills (utilities)
- Juggle multiple due dates across cards and loans
The difference between “I can afford it” and “I can afford it before Friday” is often just bill timing.
7) Debt snapshot (balances, APR, payoff progress)
While not purely “spending,” debt reports influence daily decisions because debt payments are often a top expense. This report answers: Is my debt getting better or worse, and what is it costing me?
What to look for:
- Current balances and minimums
- Interest rates (APR) where available
- A payoff progress view over time
Use it to:
- See whether extra payments are actually moving the needle
- Decide if you should shift spending cuts into debt payoff
For general guidance on credit cards and borrowing costs, the CFPB has plain language resources on credit card basics.
8) “Unusual activity” and fee monitoring
This is the quiet money saver report. It answers: What doesn’t look normal?
What to look for:
- Alerts for large transactions
- Notifications for bank fees, late fees, and overdrafts
- Category spikes (for example, dining spend 2x normal)
Use it to:
- Catch fraud quickly
- Catch bank and subscription price increases
- Prevent late fees by spotting missed payments early
9) Net worth trend (simple assets minus liabilities)
Net worth is a “north star” report because it compresses many decisions into one line: Am I moving forward overall?
You don’t need perfect investment analytics to get value here. You need a consistent snapshot.
Use it to:
- Stay motivated when month to month spending feels noisy
- See whether debt payoff and saving are offsetting each other

The quickest way to make your reports accurate
Spending tracking software reports are only as good as the underlying data. The goal is not “perfect,” it’s “trustworthy enough to act on.”
Make categories boring and consistent
Use fewer categories than you think. The more categories you create, the more time you’ll spend reclassifying, and the less likely you’ll compare months accurately.
A practical structure:
- Fixed bills (rent, insurance, utilities)
- Food (groceries, dining)
- Transportation
- Shopping
- Health
- Travel
- Debt payments
- Savings and investing
Then add a small number of custom categories that reflect your real life (childcare, pet care, home improvement).
Reconcile “messy” transactions early
If your software supports account reconciliation, use it periodically to catch mismatches. Also handle these common distortions:
- Refunds that land in a different month than the purchase
- Split transactions (big box stores, Costco type trips)
- Transfers that should not count as spending
- Cash withdrawals (either tag them, or track the cash spending separately)
Use alerts to replace willpower
Reports are great weekly. Alerts are great daily. Use them for:
- Category pacing (dining, shopping)
- Large purchase notifications
- Bill reminders
- Low balance warnings
This turns tracking into prevention, not guilt after the fact.

How to turn reports into real decisions (without living in spreadsheets)
The simplest approach is a short weekly review plus a deeper monthly review.
Weekly (10 minutes)
Open three reports:
- Cash flow summary (this month to date)
- Budget vs actual (pacing)
- Merchant spend (top 10)
Make one adjustment:
- Reduce one discretionary category cap for the rest of the month
- Cancel or pause one recurring charge
- Move one bill date (if your provider allows it)
Monthly (30 minutes)
Open five reports:
- Spending by category (trend)
- Merchant spend (top payees)
- Recurring charges
- Debt snapshot
- Net worth trend
Make one structural change:
- Reallocate your budget targets based on the last 90 days
- Increase automatic savings by a small amount (if cash flow supports it)
- Set a payoff target for one debt (even a modest extra payment)
The point is consistency. Small, repeatable decisions beat big overhauls you can’t sustain.
What to look for when choosing spending tracking software (reporting edition)
When you’re comparing tools, ask these reporting questions. They matter more than the number of charts.
| Reporting need | The question it should answer | Why it matters |
|---|---|---|
| Category trends | What is rising, falling, or volatile? | Trends drive budget targets that fit reality. |
| Drilldown | Can I click from chart to transactions quickly? | You can fix problems only when you can see the details. |
| Recurring detection | What am I paying on autopilot? | Subscriptions are the easiest costs to cut with minimal pain. |
| Budget vs actual variance | Am I on track, and by how much? | Variance prompts mid month adjustments. |
| Bills and reminders | What is due next, and will I have enough? | Prevents late fees and cash crunches. |
| Alerts | What needs attention right now? | Reduces “review fatigue” and catches anomalies. |
| Data quality tools | Can I recategorize, split, and correct mistakes easily? | Clean data keeps reports trustworthy. |
If you want a practical example of an all in one approach, MoneyPatrol positions itself as a free personal finance app with detailed financial reports, customizable alerts, account reconciliation, and a dashboard that connects to thousands of institutions. You can read more about how it approaches budgeting and tracking here: best free budgeting app.
The bottom line
The best spending tracking software is not the one with the most features, it’s the one whose reports you’ll actually open and act on. Start with cash flow, category trends, budget vs actual, merchant spend, and recurring charges. Then add bills, alerts, and debt reporting once your foundation is solid.
If you’re looking for a free place to start, you can explore MoneyPatrol’s personal finance dashboard and reporting tools at MoneyPatrol.



 Our users have reported an average of $5K+ positive impact on their personal finances
